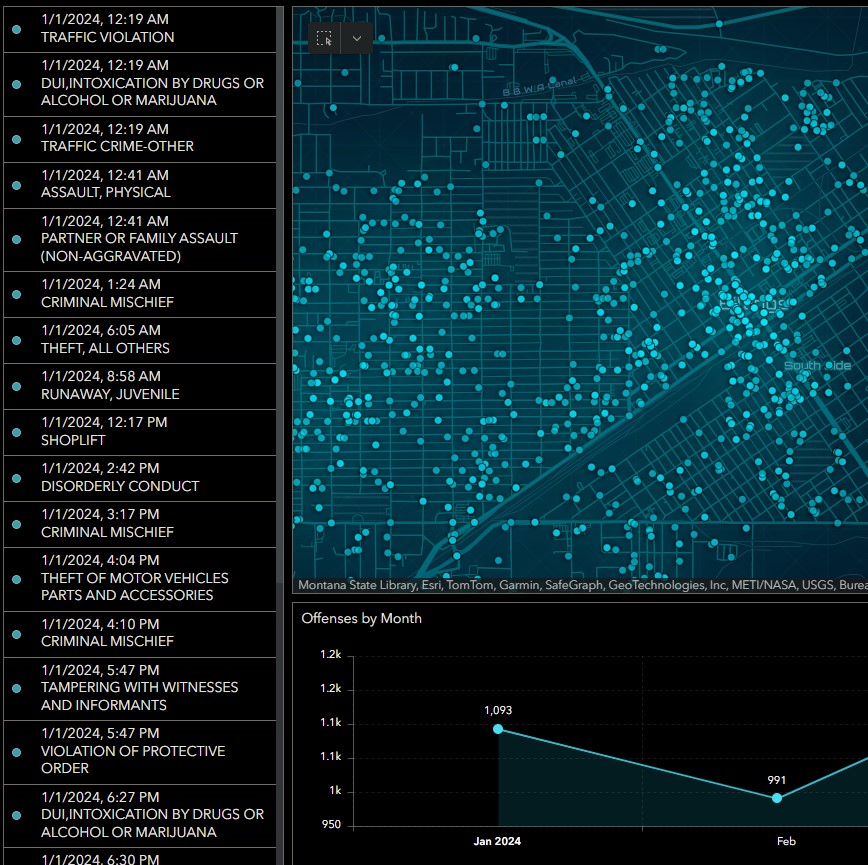
Billings Police Offenses Dashboard
This simple, user-friendly dashboard is available to the public and displays BPD offenses since January 2024. I built the application in ArcGIS Online with the Dashboards platform. The design is mobile-friendly.

Geospatial Interface Designer & Project Manager
This simple, user-friendly dashboard is available to the public and displays BPD offenses since January 2024. I built the application in ArcGIS Online with the Dashboards platform. The design is mobile-friendly.

I designed this application for a contest held by the Montana Association of Geographic Information Professionals (MAGIP), and won 2nd place. The organization provided powerline data and asked members to create an application, dashboard or map that utilized this data in a creative way.
I built the application in ArcGIS Online with the Experience Builder platform. The app integrates powerline data with LAANC US facility airspace information, and provides both 2D and 3D viewing capabilities. You can create flight animations in a 3D environment, search for powerlines near you and contribute to the project by editing and creating new powerline data. The design is mobile-friendly.

Project Safe Neighborhoods (PSN) is a national program managed by the Department of Justice and implemented by the US Attorneys’ Office in each US district. It is a collaborative effort between federal, state and local law enforcement to address and combat violent crime. The Billings Police Department receives a federal grant to spearhead the PSN project in Montana.
The PSN Data Portal is a resource where information and intelligence data can be stored and easily accessed in a seamless manner through various queries, maps, search options and visualizations. Local and federal agencies are given access to the Portal.
I built the PSN Portal in Portal for ArcGIS as law enforcement sensitive data cannot be stored in ArcGIS Online. I used several ArcGIS platforms to build the PSN Portal, including Experience Builder, Web AppBuilder and Insights.
Due to the sensitive nature of the information, the PSN Portal is not available for viewing. The link below takes you to the credits page of the application.

The Director of the Billings Police Crime Prevention Center requested I create this application for the Halloween weekend of 2022. Every Halloween, minor incidents, such as disturbances and vandalism, increase considerably. The director wanted an application that mapped and analyzed incidents from the past year’s holiday.
The application includes hotspot analysis, cluster analysis and incident filtering. Using this data, the CPC and BPD made data-driven decisions as to how to effectively allocate resources to prevent crime.
I built the application in ArcGIS Online using the Experience Builder platform.

Eyes on the Block is a voluntary program where citizens submit information about security cameras located at their homes. If a crime occurs in an area where the police need video footage, investigators can use the app to generate a report of names and addresses where residents are willing to share their footage if requested by the police.
The application has two parts: the survey accessible to the public for providing camera information and the secure application members of law enforcement use to locate available cameras.
I created the public form in ArcGIS Survey 123 and the secure mapping application in Web AppBuilder. Investigators can mark a point on the map and choose a radius within which they need video footage. The application creates a pdf report that contains names, addresses and camera information.

Interactive webmap written in Python code with the Folium library.
Data from HIFLD (Homeland Infrastructure Foundation-Level Data) website. The original dataset had over 800 observations. This map is filtered by number of fatalities per eruption. Click on a marker for more information about that incident. Filter the results with the legend in the top-right of the map.
To view the map in a separate browser tab, click the link below.
Kepler.gl is an open source geospatial analysis tool and web based application for visualizing geolocation datasets. This application displays the 2019 incidents for Billings Police binned in hexagons across the city. The taller the hexagon, the more incidents that occurred in that area.
To view the application in a new browser tab, click the link below.
More information about Kepler GL is available here.
Interactive Tableau dashboard displays total sales by area on a map of Europe and profit/sales data by customer in a scatter plot. Selecting a circle on the map updates the scatter plot to only include customers from that area.

Geospatial Interface Designer & Project Manager